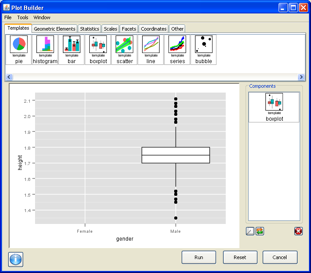
Box plots allow you to graphically examine and compare the median, quantiles, and outliers of a variable or set of variables. The box plot is one of the templates found in the Plot Builder.
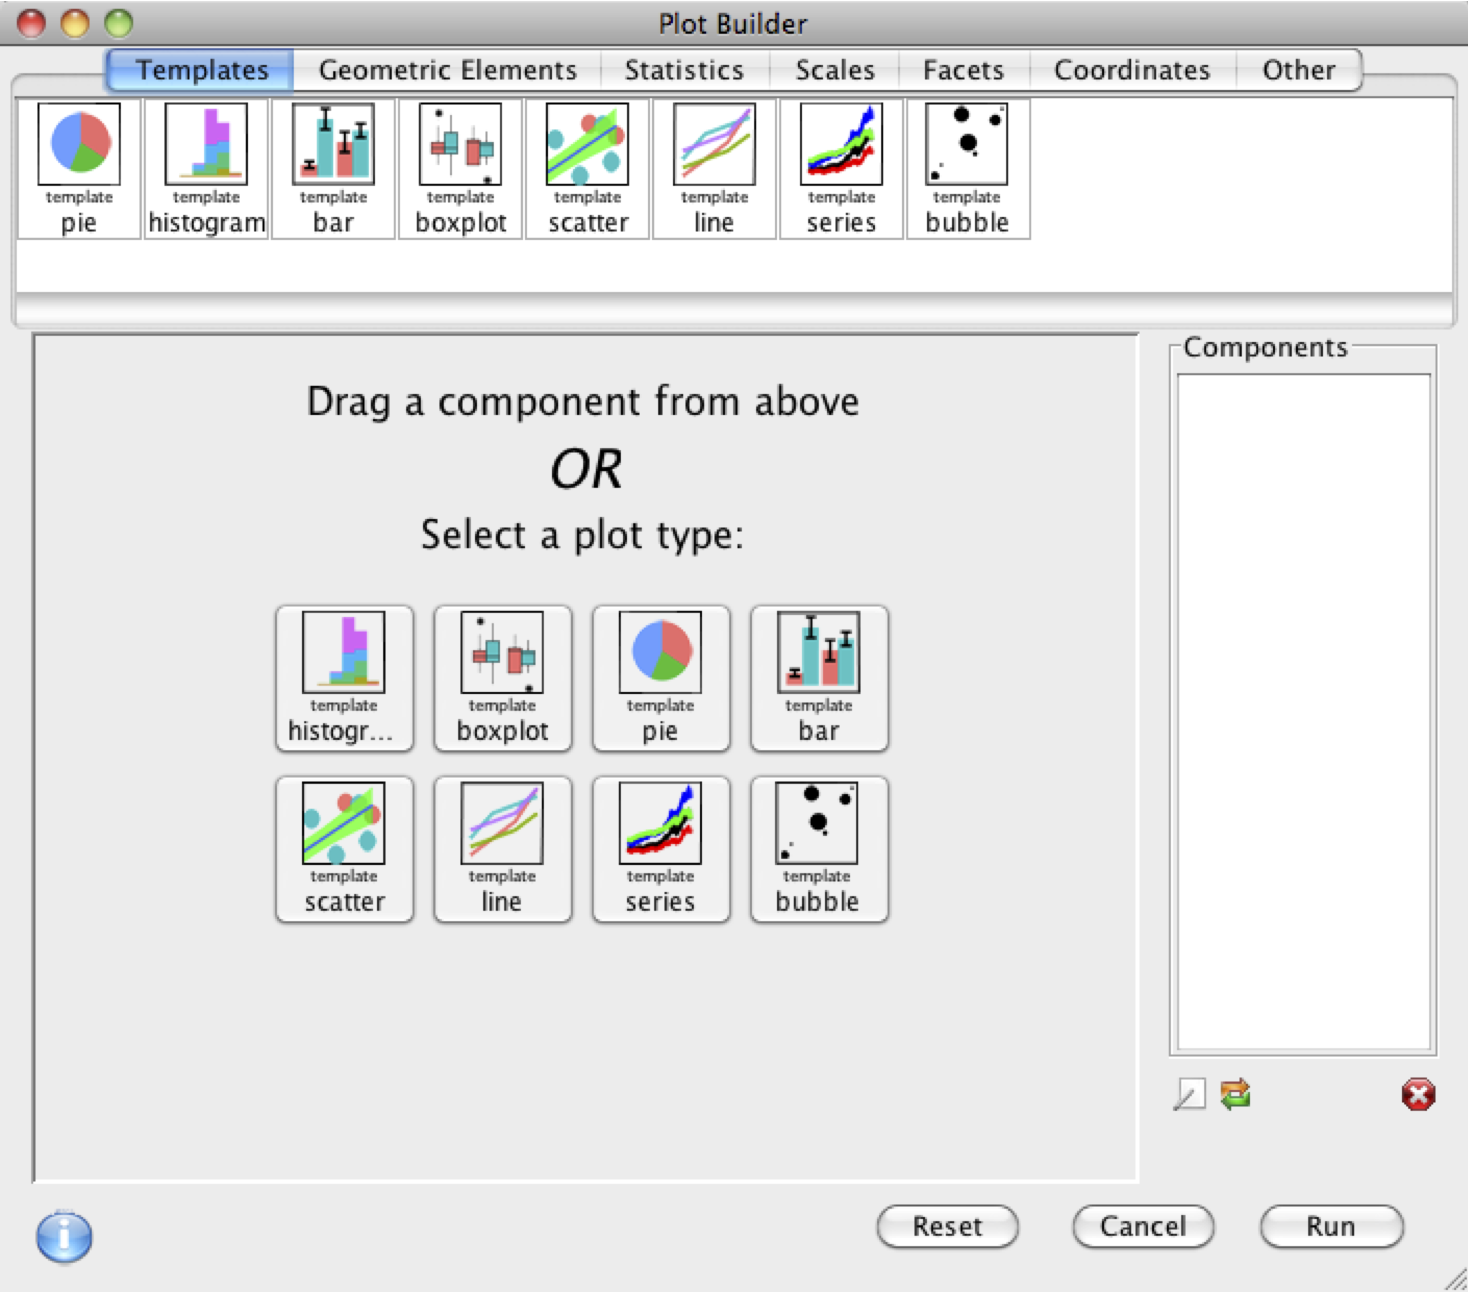
To begin, open the Plot Builder by choosing Plot Builder from the Plots menu on the menu bar of the Console window. The following window will appear.

Then, click the Box button in the templates pane, or choose Box from the Select Plot Type area in the center of the Plot Builder window. The following window will appear

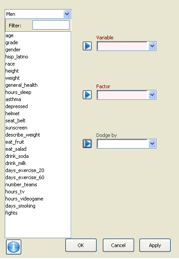
Choose the desired file from the pull down menu. Choose a numeric variable and add it to the Variable space by clicking the right arrow. Choose a categorical variable and add it to the Factor space by clicking the right arrow. Click OK.

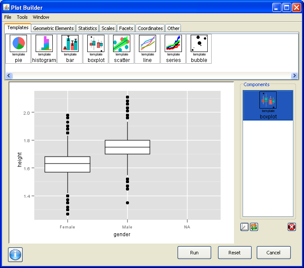
This example only had one box plot, but we could use data that had several factor levels to create side-by-side box plots for comparison.
