Load the birth weight data with data(birthwt).
low   - indicator of birth weight less than 2.5 kg.
race  - mother's race (1 = white, 2 = black, 3 = other).
smoke - smoking status during pregnancy.
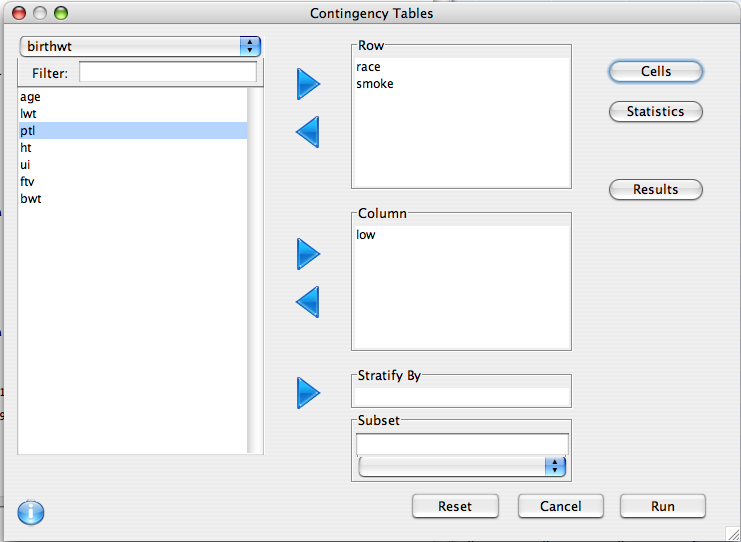
We wish to know if either smoking or race is associated with higher rates of low birth weight. So race and smoke are entered into the row list, and low is entered into the column list.
Clicking run yeilds the following code:
tables<-contingency.tables(
     row.vars=d(race,smoke),
     col.vars=d(low),data=birthwt)
tables<-add.chi.squared(tables)
print(tables,prop.r=T,prop.c=T,prop.t=F)
remove(tables)
================================================================================================================

               ==================================================================================
                                    ========== Table: race by low ==========
                       | low
                  race |        0  |        1  | Row Total |
-----------------------|-----------|-----------|-----------|
           1  Count    |       73  |       23  |       96  |
              Row %    |   76.042% |   23.958% |   50.794% |
              Column % |   56.154% |   38.983% |           |
-----------------------|-----------|-----------|-----------|
           2  Count    |       15  |       11  |       26  |
              Row %    |   57.692% |   42.308% |   13.757% |
              Column % |   11.538% |   18.644% |           |
-----------------------|-----------|-----------|-----------|
           3  Count    |       42  |       25  |       67  |
              Row %    |   62.687% |   37.313% |   35.450% |
              Column % |   32.308% |   42.373% |           |
-----------------------|-----------|-----------|-----------|
          Column Total |      130  |       59  |      189  |
              Column % |   68.783% |   31.217% |           |


            Large Sample
       Test Statistic    DF p-value | Effect Size est.  Lower (%) Upper (%)
Chi Squared 5.005        2  0.082   | Cramer's V  0.163 0 (2.5)   0.293 (97.5)
-----------


               ==================================================================================
                                   ========== Table: smoke by low ==========
                       | low
                 smoke |        0  |        1  | Row Total |
-----------------------|-----------|-----------|-----------|
           0  Count    |       86  |       29  |      115  |
              Row %    |   74.783% |   25.217% |   60.847% |
              Column % |   66.154% |   49.153% |           |
-----------------------|-----------|-----------|-----------|
           1  Count    |       44  |       30  |       74  |
              Row %    |   59.459% |   40.541% |   39.153% |
              Column % |   33.846% |   50.847% |           |
-----------------------|-----------|-----------|-----------|
          Column Total |      130  |       59  |      189  |
              Column % |   68.783% |   31.217% |           |


            Large Sample
       Test Statistic    DF p-value | Effect Size est.  Lower (%) Upper (%)
Chi Squared 4.924        1  0.026   | Cramer's V  0.161 0 (2.5)   0.304 (97.5)
-----------


================================================================================================================
From the output we can see that 42% of African Americans had a low birth rate versus 24% of Caucasians and 37% for Others. The differences between the races did not pass the bar of statistical significance at the 0.05 level, with a chi squared p-value of 0.082. Smoking on the other hand seems to be fairly strongly related to low birth weight. 41% of babies with mothers who were smokers were born underweight compared to 25% of those with non-smoking mothers. This passed the bar of statistical significance with a p-value of 0.026
 Deducer: A GUI for R