We will be looking at the Davis dataset, which records both the self reported, and measured heights and weights of 200 individuals. Some data values are missing.
Load the data by entering the following into the console:
data(Davis)
Variables:
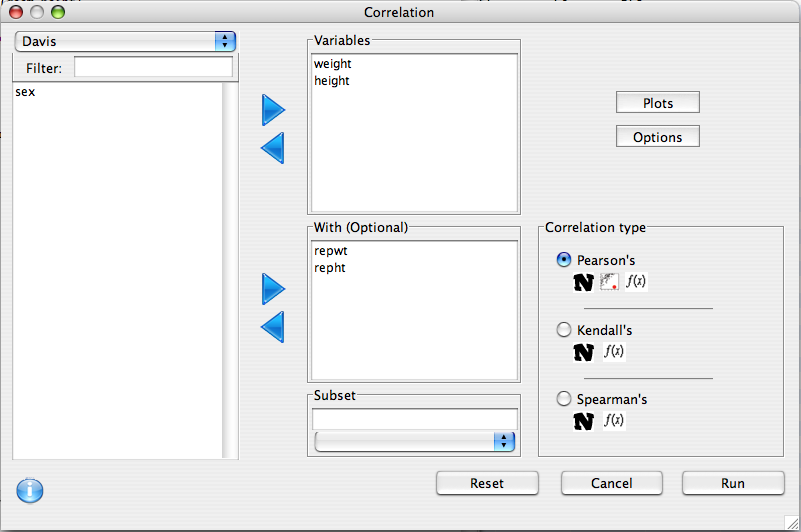
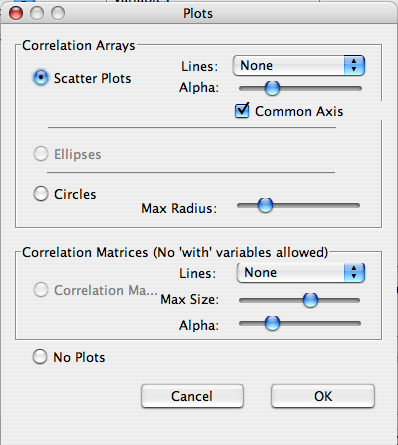
We are interested to examine the relationship between weight <--> reported weight and height <--> reported height, so we will put weight and height in the top list, and repwt and repht in the 'With' list. It's always a good idea to visualize the data, so we'll request a scatter plot be printed.
corr.mat<-cor.matrix(variables=d(weight,height),
	with.variables=d(repwt,repht),
	 data=Davis,
	 test=cor.test,
	 method='pearson',
	alternative="two.sided")
print(corr.mat)
qscatter_array(d(weight,height),
	d(repwt,repht),
	data=Davis)
rm('corr.mat')
> corr.mat<-cor.matrix(variables=d(weight,height),
+ with.variables=d(repwt,repht),
+ data=Davis,
+ test=cor.test,
+ method='pearson',
+ alternative="two.sided")
> print(corr.mat)

                       Pearson's product-moment correlation

             weight          height
repwt    cor 0.8358          0.6033
           N 183             183
         CI* (0.7861,0.8748) (0.5022,0.6881)
      stat** 20.48 (181)     10.18 (181)
     p-value 0.0000          0.0000
------------
repht    cor 0.6363          0.7446
           N 183             183
         CI* (0.5412,0.7154) (0.6722,0.803)
      stat** 11.10 (181)     15.01 (181)
     p-value 0.0000          0.0000
------------
	** t (df)
	 * 95% percent interval

	HA: two.sided

> qscatter_array(d(weight,height),
+ d(repwt,repht),
+ data=Davis)
Warning messages:
1: Removed 17 rows containing missing values (geom_point).
2: Removed 17 rows containing missing values (geom_point).
3: Removed 17 rows containing missing values (geom_point).
4: Removed 17 rows containing missing values (geom_point).
> rm('corr.mat')
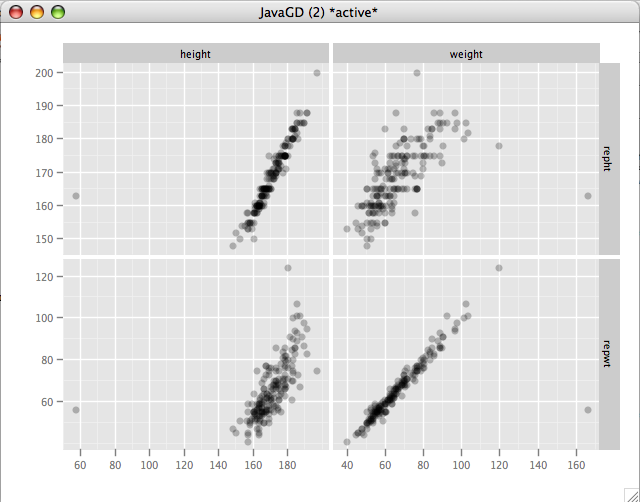
The correlation of weight and repwt should be very close to 1 if people are honest about thier weights. The actual correlation is .8358. Looking at the scatterplot we see a serious anomaly. One subject reported a weight of about 160kg. when their actual weight was less than 60kg. Opening the Davis data in the Data viewer immediately shows us what the problem is.
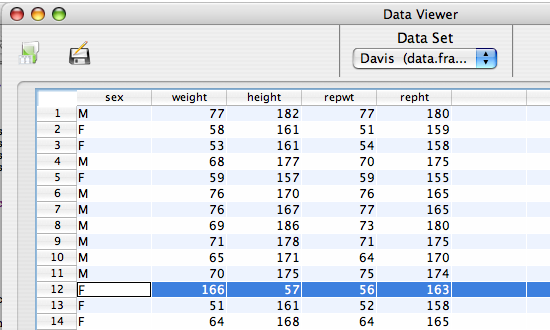
Looking at the data it seems reasonable to suggest that the weight and height of subject 12 were transposed during data entry, and that the subject's real height is 166 and their weight is 57. We can change this directly in the Data viewer, and re-run the analysis.
> corr.mat<-cor.matrix(variables=d(weight,height),
+ with.variables=d(repwt,repht),
+ data=Davis,
+ test=cor.test,
+ method='pearson',
+ alternative="two.sided")
> print(corr.mat)

                       Pearson's product-moment correlation

             weight          height
repwt    cor 0.9859          0.7824
           N 183             183
         CI* (0.9811,0.9894) (0.719,0.833)
      stat** 79.22 (181)     16.90 (181)
     p-value 0.0000          0.0000
------------
repht    cor 0.7521          0.9758
           N 183             183
         CI* (0.6814,0.8089) (0.9677,0.9819)
      stat** 15.35 (181)     60.03 (181)
     p-value 0.0000          0.0000
------------
	** t (df)
	 * 95% percent interval

	HA: two.sided

> qscatter_array(d(weight,height),
+ d(repwt,repht),
+ data=Davis)
Warning messages:
1: Removed 17 rows containing missing values (geom_point).
2: Removed 17 rows containing missing values (geom_point).
3: Removed 17 rows containing missing values (geom_point).
4: Removed 17 rows containing missing values (geom_point).
> rm('corr.mat')
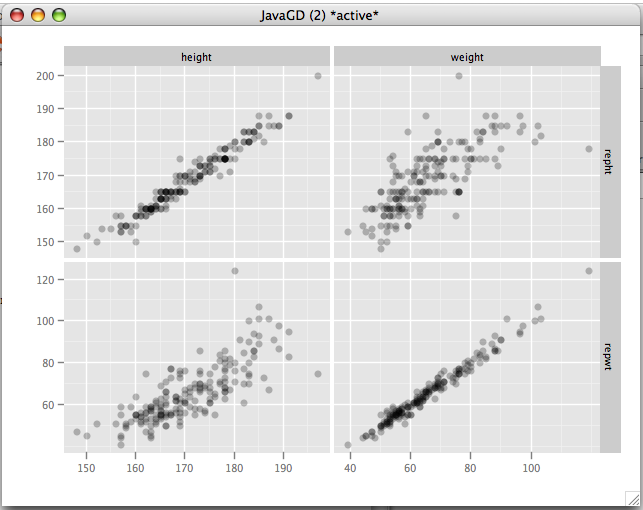
The correlations for weight and height are .9859 and .9758 respectively, which is very close to 1, indicating very little information is lost by just asking a person their height and weight as opposed to measuring it. The plots also run very close to the 45 degree line, so there doesn't seem to be much upward or downward bias in their estimates. If anything, shorter people may be over-estimating their heights by just a little.