Calculates descriptive statistics for a set of variables. Possibly stratified by another set of variables.
In this example, we are using the data set mtcars which can be loaded by typing data(mtcars).
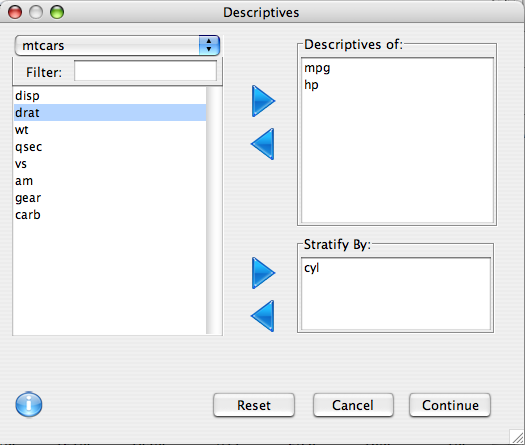
To calculate descriptive statistics, select Descriptives from the Analysis menu on the menu bar of the Console window. The following window will appear.

Choose the desired file from the pull down menu (Here we are using the mtcars dataset). Select the variables for which to create descriptives and add them to the Descriptives of: space by clicking on the right arrow. Click Continue.
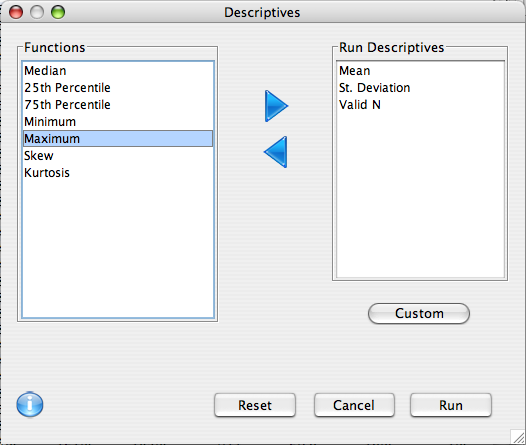
Another window will appear, with options for specifying what type of descriptive statistics should be run.

On this pane, select the function(s) desired (e.g., mean) from the list of common descriptives on the left side. Add it to the Run Descriptives space by clicking on the right arrow. Click Run. The descriptives will appear in the Console window.

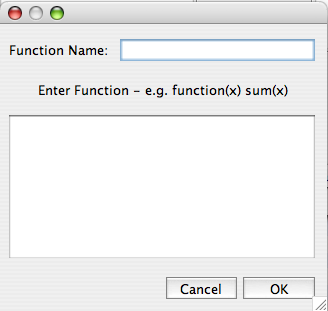
One can run custom descriptives (not listed on the left of the options pane) using the custom button.

This dialog uses the descriptive.table function, and the above example yields the following call.
descriptive.table(vars = d(mpg,hp) ,
	strata = d(cyl),data= mtcars,
	func.names =c("Mean","St. Deviation","Valid N")))
$`cyl: 4 `
        Mean St. Deviation Valid N
mpg 26.66364      4.509828      11
hp  82.63636     20.934530      11

$`cyl: 6 `
         Mean St. Deviation Valid N
mpg  19.74286      1.453567       7
hp  122.28571     24.260491       7

$`cyl: 8 `
        Mean St. Deviation Valid N
mpg  15.1000      2.560048      14
hp  209.2143     50.976886      14