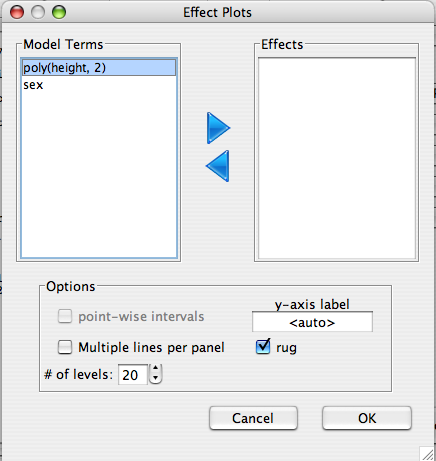
Visualize the marginal effects of the model.
Dialog
The effects of the variables in the 'Effect' list are plotted using the model, assuming that all other variables are set to thier typical values (i.e. their means).
- Point wise intervals Plot the pointwise confidence intervals along with the mean effect.
- y-axis label label for the y-axis of the plot
- Multiple lines per panel If the effect is an interaction effect, should the interaction be ploted as multiple lines within a single panel, or as seperate panels.
- rug small lines on the x-axis denoting the distribution of data points.
- # of levels The number of levels for which the effect should be evaluated.
