Frequency tables provide descriptive information for categorical and ordinal variables. They display the number of cases that fall into each category of a specific variable, as well as calculate percentages.
On this page we will be using the birthwt dataset, which can be loaded by typing data(birthwt) into the Console. The birthwt dataset contains information on the birth weight of 189 infants.
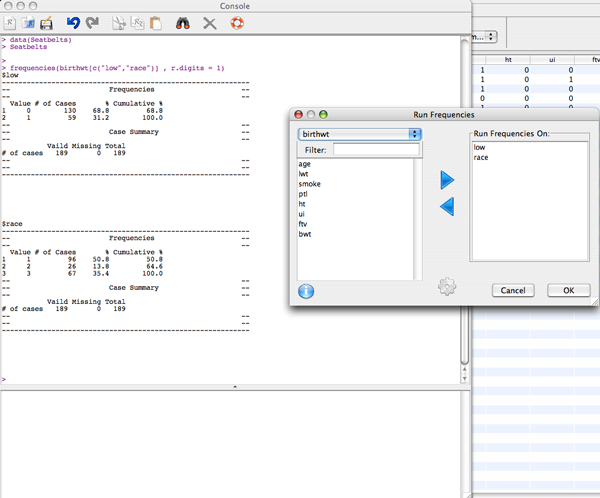
To run frequencies, choose the frequency dialog, which is located in the Analysis menu under Frequencies from the menu bar on the Console window. With the dialog open, choose the data set on which to run frequencies by using the top left, pull down menu on the Run Frequencies pane. In this example, we choose the birthwt data frame in the variable selector. Other open files could be chosen from the pull down menu.
We can move variables into the Run Frequencies On list on the right to run their frequencies by selecting the variable we want to add, and clicking on the right arrow. Variables can be removed from the Run Frequencies On space by clicking on the left arrow.
In our example two variables have been selected:

The output appears in the output pane of the Console window. From the output, we can see that 59 babies (or 31.2%) were underweight. 96 mothers (or 50.8%) were white, while 13.8% were black. There were no missing values present in either of these variables.
Clicking the options button (the gear icon on the Run Frequencies pane) allows us to alter the number of digits the percentages are rounded to. The default is 1 decimal place.
Running the above yields the following frequencies call:
frequencies(birthwt[c("low","race")] , r.digits = 1)