Linear Discriminant Analysis (LDA) is a statistical technique used to investigate the relation between a set of continuous, normally distributed independent variables and a categorical outcome. This objective is similar to binary or multinomial logistic regression, although the calculation procedures and assumptions about the data are different. LDA follows a Bayesian approach, that defines an a priori classification just based on frequencies, and then adjusts it according to the relations observed between variables.
LDA defines as many 'discriminant functions' as the number of categories of the outcome minus one, so that each function is a linear combination of the independent variables. As in Principal Component Analysis or Factor Analysis, these functions are ordered by the amount of variance that the explain, and if the number of original independent variables is very high, it is customary to perform a preliminary selection according to their explanatory power.
The main dialog is used to define the variables of interest for the analysis.
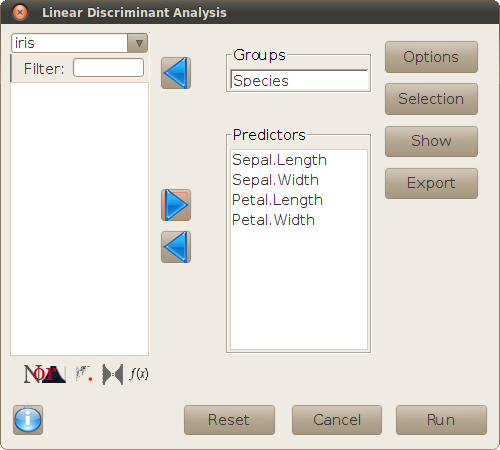
The buttons on the right hand side of the dialog open new sub-dialogs, for setting the options of the analysis and performing additional operations, as explained in the following sections.
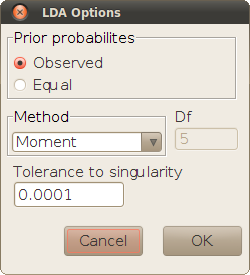
This sub-dialog sets the options of the lda function used for the analysis.
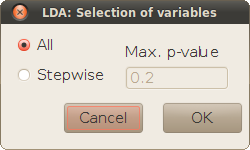
LDA is normally used when there is an educated inital hypothesis about the frequency of each category, but not necessarily about how those frequencies are related to the independent variables. Therefore, the initial selection of independent variables is often overredundant and includes variables that may be irrelevant for the classification.
The sub-dialog Selection allows to do a stepwise variable selection before the analysis, using the Wilks' lambda criterion, to keep only the independent variables that have a relatively important explanatory power. The selection starts with the variable that discriminates best between categories, and new variables are progressively added, while the gain in explained variance is over a threshold (indicated by a maximum p-value for the comparison between the current selection and the next step).
This sub-dialog is used to print tables and plots that give additional information about the linear discriminant functions and the goodness of a posteriori classification.
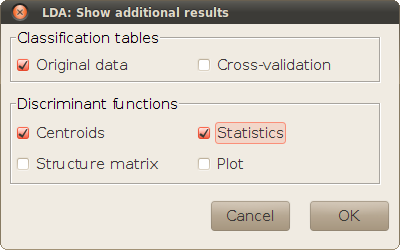
The classification tables show how many of the originally observed cases would be correctly reclassified (in the diagonal cells) or misclassified (off-diagonal cells), using the LDA model. The actual discriminant functions that are used for the reclassification depend on the selected checkboxes. If Original data is selected, the discriminant functions are calculated from the whole data set for all observations. With Cross-validation, a different set of discriminant functions is used for each observation, calculated by leaving out that observation (a Jacknife re-classification). The availability of Cross-validation tables depends on the method selected for the analysis in the Options sub-dialog.
The checkboxes within this panel are used for showing detail analyses about the discriminant functions:
lda). Wilks' lambda is a ratio of unexplained variance that may vary between 0 and 1, so that the lower is this value, the more a function discriminates between categories. The table shows a Wilks' lambda for each function, although this statistic is usually calculated for groups of functions as well, by multiplying the individual lambdas. For instance, the lambda for the two first discriminant functions is just the product of the first and second lambdas. The meaning of the 'canonical correlation' is just opposite to Wilks' lambda: it is equivalent to the root square of the R2 coefficient calculated in each ANOVA.
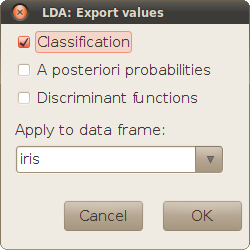
The result of LDA is often used for classifying new cases where only the independent variables is known. This subdialog allows to save the result of this operation, and intermediate calculations if wanted (the values of the discriminant functions, and the a posteriori probabilities for each category whence the classification criterion comes). The data frame selected for this operation must have the same independent variables as the data frame used for defining the model. The same data frame is chosen by default. (Leaving that data frame would result in the reclassification used for calculating the first clssification table in the sub-dialog Show.)
