The anorexia data contains data on the pre and post treatment anorexia of some young female patients. We will create a new variable wtchange which is equal to post-weight minus pre-weight.
Treat - Factor of three levels: "Cont" (control), "CBT" (Cognitive Behavioural treatment) and "FT" (family treatment).
Prewt - Weight of patient before study period, in lbs.
Postwt- Weight of patient after study period, in lbs.
data(anorexia)
anorexia$wtchange <-anorexia$Postwt - anorexia$Prewt
We will test whether the control group experienced a significant drop in weight.
anorexia.sub<-subset(anorexia,Treat=="Cont")
descriptive.table(anorexia.sub[c("wtchange")],func.names =c("Mean","St. Deviation","Valid N"))
one.sample.test(variables=c(wtchange),
data=anorexia.sub,
test=t.test,
alternative="two.sided")
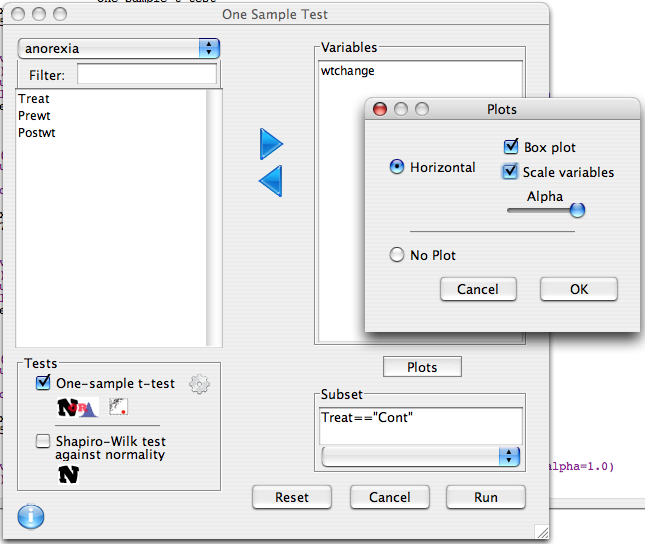
onesample.plot(variables=c(wtchange),data=anorexia.sub,test.value=0.0,type='box',alpha=1.0)
rm(anorexia.sub)
> anorexia.sub<-subset(anorexia,Treat=="Cont")
> descriptive.table(anorexia.sub[c("wtchange")],func.names =c("Mean","St. Deviation","Valid N"))
$`strata: all cases `
         Mean St. Deviation       Valid N
    -0.450000      7.988705     26.000000

> one.sample.test(variables=c(wtchange),
+ data=anorexia.sub,
+ test=t.test,
+ alternative="two.sided")
                               One Sample t-test
         mean of x 95% CI Lower 95% CI Upper          t df  p-value
wtchange     -0.45    -3.676708     2.776708 -0.2872254 25 0.776307
  HA: two.sided
  H0:  mean = 0
> onesample.plot(variables=c(wtchange),data=anorexia.sub,test.value=0.0,type='box',alpha=1.0)
> rm(anorexia.sub)
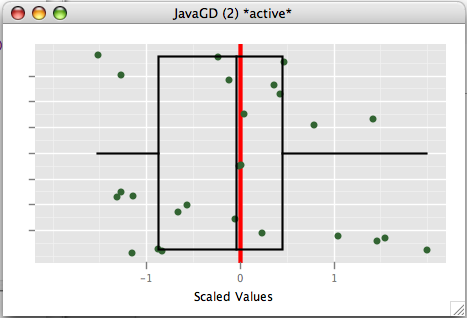
The control group lost .45 pounds on average, though this was not a significant drop (p-value = 0.776). Visually we can see from the box and jitter plot that the observations are clustered around 0.0.
 Deducer: A GUI for R