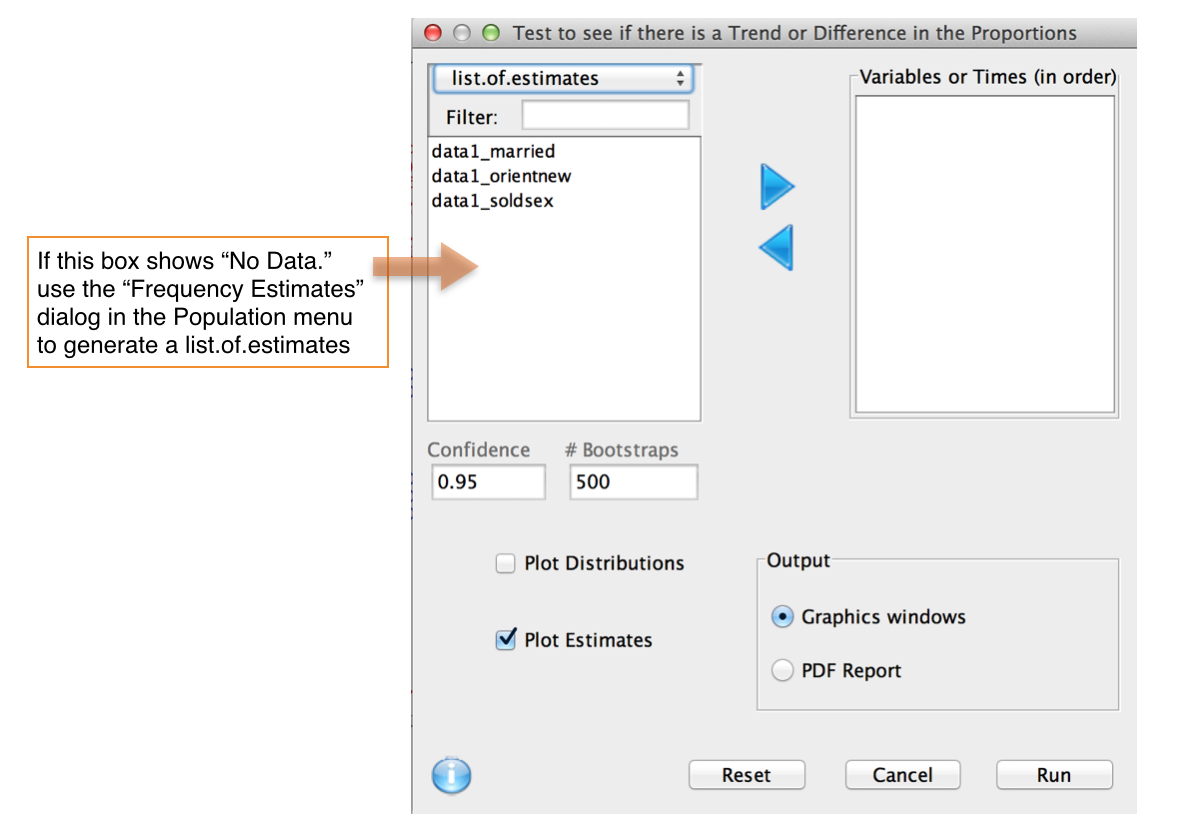
This dialog compute a hypothesis test of trend in prevalences based on a likelihood-ratio statistic.

Description
This function takes a series of point estimates and their associated standard errors and computes the p-value for the test of a monotone decrease in the population prevalences (in sequence order). The p-value for a monotone increase is also reported. An optional plot of the estimates and the null distribution of the test statistics is provided. More formally, let the K population prevalences in sequence order be p_1. ..., p_K. We test the null hypothesis:
H_0 : p_1 = ... = p_K
vs
H_1 : p_1 >= p_2 ... >= p_K
with at least one equality strict. A likelihood ratio statistic for this test has been derived (Bartholomew 1959). The null distribution of the likelihood ratio statistic is very complex but can be determined by a simple Monte Carlo.
Usage
First use the Population menu to compute prevalence estimates for the different stages. Then return to this dialog and enter them (in sequence order). A detailed video example is given here.
References
Bartholomew, D. J. (1959). A test of homogeneity for ordered alternatives. Biometrika 46, 36-48.