Contingency tables (sometimes called crosstabs) are used to summarize and analyze the joint distribution of two variables, possibly stratified by a third. A table of observation counts will be created for each combination of the variables in the row list and each variable in the column list. If a stratum variable is specified, separate tables are created for each level of the variable. Note that these are the sample values and are not adjusted for the RDS design.
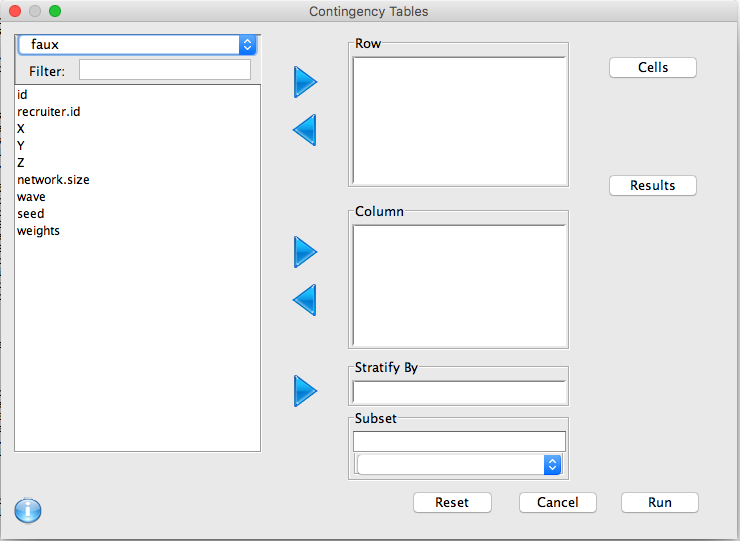
To create a contingency table, choose Contingency Tables from the Analysis menu on the menu bar of the Console window. The following window will appear.

To create a contingency table to relate the answers to two different survey questions add the row variable and column variable to the appropriate spaces and click Run. The results will appear in the Console Window.
In addition to observation counts, there are a number of additional cell values that can be displayed.