Description
The Transform variables dialog provides a variety of scaling and binning options.
Dialog
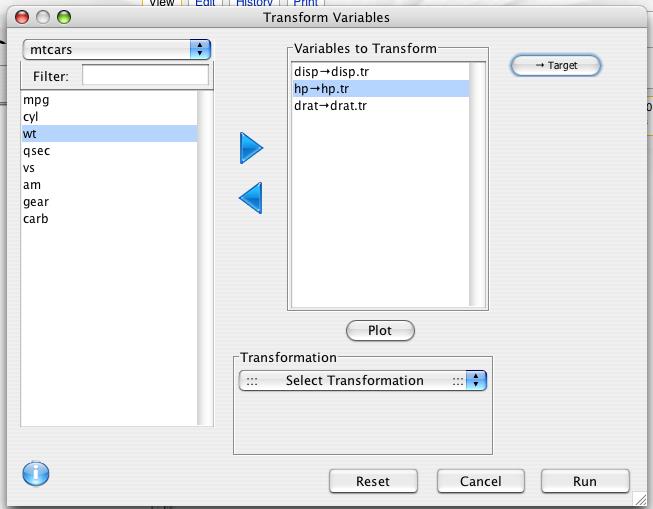
To convert data in a particular column to another format (e.g., convert meters to inches), choose Transform from the Data menu on the menu bar of the Console window. The following window will appear.
Add the desired variable to the Variables to Transform space. Choose the appropriate transformation from the pull down menu or choose Enter Function under the Custom option. (Scroll down to the bottom of the pull down menu list.) Click Run. The transformed variable will appear as the last column in the Data Viewer. (Scroll to see the last column.)
Each variable in the "Transform to Variable" list has a transformation applied to it, and the resulting transformed variable is saved to a new target variable. The target variable name can be altered by clicking the Target button.
Kinds of transformations
A variety of transformation options are provided. These can be used to make variables more normal looking, to scale them to a particular range, to stabilize their variance, or to bin them into categorical groups.
Center
- Description
- This transformation scales the variable so that it has a mean of 0.
- Purpose
- To scale variables so that they have identical mean.
Standardize
- Description
- This transformation scales the variable so that it has a mean of 0, and a standard deviation of 1.
- Purpose
- To scale variables so that they are comparable regardless of unit of measurement.
Robust Standardize
- Description
- This transformation scales the variable so that it has a median of 0, and a median absolute deviation of 1.
- Purpose
- To scale variables so that they are comparable, even if outliers are present.
Range
- Description
- This transformation scales the variable so that it is between 0 and 1.
- Purpose
- Puts all variables in the same range.
Box-cox
- Description
- A multivariate transformation that attempts to map the variables to multivariate normality
- Purpose
- Transform to the normal distribution. A useful prepossessing step for analysis methods that assume normality.
Rank
- Description
- Replaces values by their rank. Ties can be broken in a variety of ways (Average, First, Random, Minimum, Maximum).
- Purpose
- To remove outliers and skewness
Log
- Description
- Takes the natural log (i.e. the log base e) of the variable. Can only be used on values greater than 0.
- Purpose
- Can remove positive skew, and stabilize variance.
Log + 1
- Description
- Takes the natural log (i.e. the log base e) of the variable with 1 added to it. Can only be used on values greater than -1.
- Purpose
- Can remove positive skew, and stabilize variance. Can be used on variables with values of 0.
Square root
- Description
- Square root. values must be non-negative
- Purpose
- Stabilizes variance for count data.
Absolute value
- Description
- makes values positive
- Purpose
- When the magnatude of the variable is of interest, and not its direction.
Squared
- Description
- Takes the square
Inverse
- Description
- The inverse (i.e. 1/x). values must be non-zero.
Reciprocal root
- Description
- -1/sqrt(x)
Arcsine
- Description
- Takes the arcsine of the square root of the variable..
- Purpose
- Stabilizes variance for proportions.
Quantiles
Splits variable into groups with equal numbers of observations.
Equal width
Splits variable into groups with equally spaced intervals.
Custom
Define your own transformation as a function of x. for example: log(x,10) gives the log based 10 transformation.
Example generated code
variables <- c("disp","hp","drat")
into.variables <- c("disp.tr","hp.tr","drat.tr")
for(i in 1:length(variables))
	mtcars[[into.variables[i]]] <- rescaler(mtcars[[variables[i]]])
rm(list=c('variables','into.variables'))
