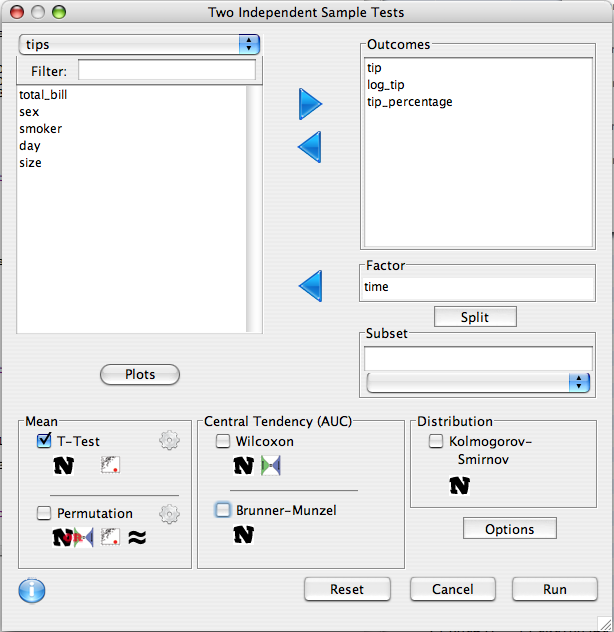
Determines if two groups differ in distribution.
The grouping factor is put in the factor list. The statistical tests will determine if there is a differences between the groups on any of the variables in the 'Outcomes' list. The Groups can be specified using the Split button. Test options can be altered with the options button.

If the factor variable has two levels, the groups do not need to be defined, however, if the variable is continuous or has more than two levels, the two groups must be specified.

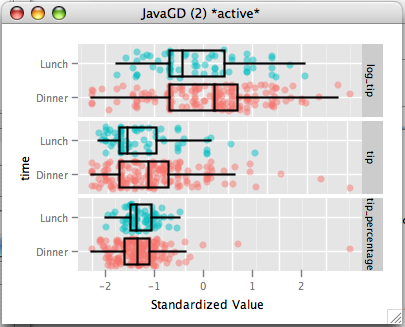
The plots dialog can be used to specify a plot summary.


t-testThe t-test tests whether two means are different from one another. Details of the procedure can be found here. By default the Welch t-test is performed, which doesn't require the assumption of equal variance. Clicking the test options allows one to change to the student's t-test, which does rely on the equal variance assumption. the Welch test requires that the sample sizes are sufficiently large, while the student's test requires that either the data be normally distributed, or the sample size is sufficiently large. Practically speaking, the Welch test performs well even at very small sample sizes when the data is normally distributed. Both tests are sensitive to outliers.
Like the t-test, the permutation test compares the means of two samples. Unlike the t-test, the permutation test does not require that the samples be large, so long as the exchangeability assumption holds, which is a similar assumption to the equal variance assumption. If this assumption does not hold, the default permutation test, which permutes the t-statistic, still still be valid if the samples are large enough.
Unlike the t-test, which measures the difference between two groups as the difference between their means, tests of central tendency use a different measure called the area under the curve, or AUC. The AUC is defined as the probability that a random observation drawn from one group has a higher value than one drawn from the other group (plus 1/2 the probability they have exactly the same value). So, if the AUC=1/2, then an observation in one group is not more likely to be above the other group, and visa versa, implying that the two groups have the same central tendency.
The Wilcoxon test, also called the Mann-Whitney test, tests whether the area under the curve is not equal to 1/2. It assumes that there is a sufficiently large sample, and exchangability.
This test is the same as the Wilcoxon except that it does not require the exchangability assumption.
Tests whether two groups have the same probability distribution. Differences in distribution can manifest in any manner, such as different means, standard deviations, or skew. Requires a sufficiently large Sample.