Description
Contingency tables (sometimes called crosstabs) are used to summarize and analyze the joint distribution of two variables, possibly stratified by a third. A table of observation counts will be created for each combination of the variables in the row list and each variable in the column list. If a stratum variable is specified, separate tables are created for each level of the variable.
Dialog
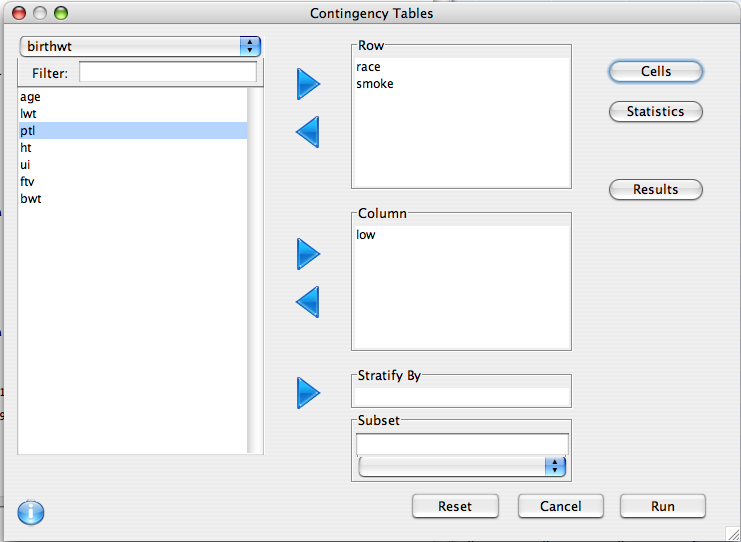
To create a contingency table, choose Contingency Tables from the Analysis menu on the menu bar of the Console window. The following window will appear.
To create a contingency table to relate the answers to two different survey questions add the row variable and column variable to the appropriate spaces and click Run. The results will appear in the Console Window.
Cells
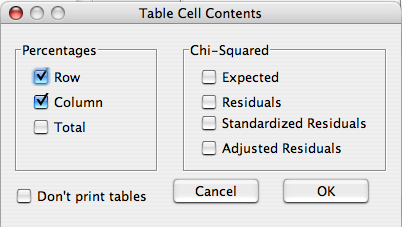
In addition to observation counts, there are a number of additional cell values that can be displayed.
- Percentages
- Row - Percentage in cell out of observations within each row
- Column - Percentage in cell out of observations within each column
- Total - Percentage in cell
- Chi-squared
- Expected - The expected count of the cell if there were no relationship between the two variables
- Residuals - The observed count minus the expected count.
- Standardized residuals - The residuals standardized such that (if the two variables were independent) they have mean 0 and standard deviation 1. These residuals are useful in determining which cells of a contingency table contribute most to a significant chi-squared test.
- Adjusted residuals - These adjust the residuals by the row and column totals.
Statistics
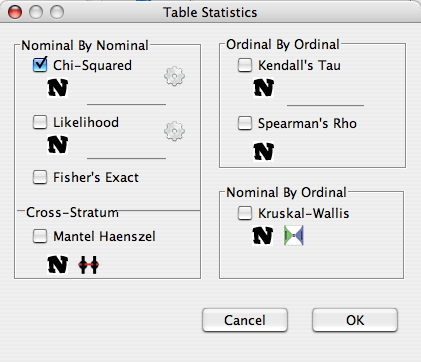
There is a rich variety of statistical tests that can be performed in the contingency table framework. Quite a few of the most important ones are covered by the dialog.
Comparing two nominal variables
Nominal variables are factors with no natural ordering such as race and gender (as opposed to education and tax bracket). There are three tests implemented that can be used to compare two nominal variables:
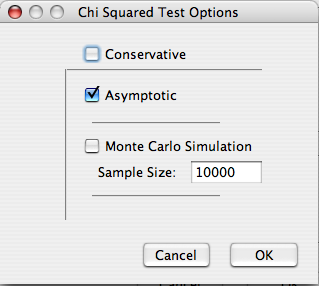
- Chi-Squared test - Perhaps the most popular and pervasive method, the chi-squared test can determine if there are any significant departures from independence. The Chi-squared test assumes the the cell counts are sufficiently large. Precisely what constitutes 'sufficiently large' is a mater of some debate. One rule of thumb is that all expected cell counts should be above 5. If this is violated, or if one wishes to be safe, the p-value can be calculated via monte carlo method. This yields an approximate p-value that is more accurate at small sample sizes, and can be made arbitrarily exact by increasing the simulation sample size. By default no Yates continuity 'correction' is used, and the mid p-value is used for the monte carlo simulation. These can be changed to their more conservative counterparts by selecting the 'Conservative' option.
- Likelihood Ratio - This test, also known as the G test is an alternative to the Chi-squared test, and assumes that the cell counts are sufficiently large. Williams' continuity 'correction' can be used by selecting the Conservative option.
- Fisher's Exact - This test can be used with very small sample sizes and very sparse data. It is exact, in that it is based on the exact distribution of the data. Deducer gives the mid p-value version of this test, whereas many other software packages give a more conservative version.
Comparing two nominal variables stratified by a third
- Mantel-haenszel - This test is like the Chi-squared test except that it adjusts for the stratification of a third variable. It assumes that the cell counts for a collapsed table (i.e. one that ignores the stratification variable) are sufficiently large. Additionally it assumes that the relationship between the two variables of interest is constant across strata.
Comparing two ordinal variables
Ordinal variable have a natural order, such as building floor or height.
- Kendall's tau - This is a measure of association similar to Pearson's correlation, but valid for discrete variables. It assumes a sufficiently large sample size.
- Spearman's rho - Spearman's rho is the result of calculating the Pearson's correlation on the rank transformed data.
Both correlations measure the strength of monotonic assosiation between the two variables on a scale similar to Pearson's Correlation. The relative virtues of two approaches have been debated, and some favor the use of kendall's tau.
Comparing one nominal and one ordinal variable
- Kruskal-Wallis - This test determines whether the ordinal variable tends to be greater in some categories of the nominal variable as opposed to others. It assumes a sufficiently large N, and exchangability, which is similar to an equal variance assumption.
The mid p-value
Through out Deducer, though not R in general, we use the mid p-value for all exact and monte carlo tests as opposed to the "standard exact" p-value. The mid p-value was chosen because it will always be as close or closer to it's nominal level than it's more conservative counterpart. A more thorough discussion is available for interested readers.
Examples
Nominal by Nominal


