Examines the (increasing or decreasing) relationship between two or more continuous or ordinal variables.
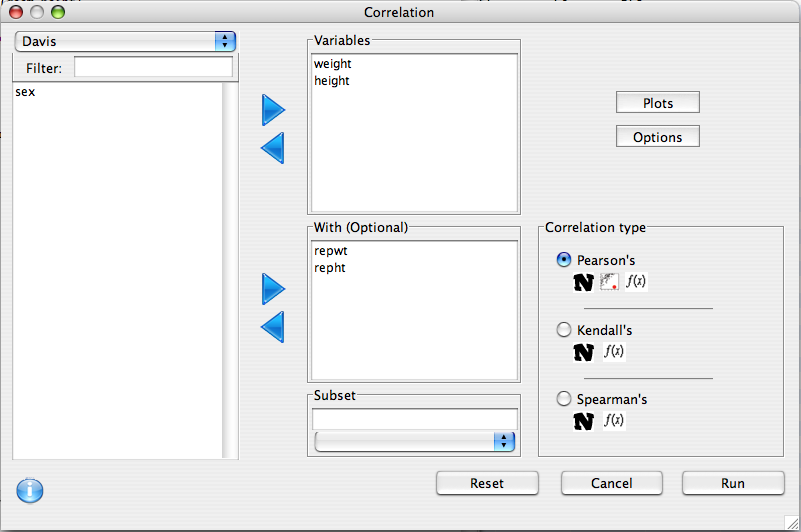
There are two lists (the 'Variable' and 'With' lists) which can be used to determine which pairs of variables will have correlations calculated. If there are variables present in the 'With' list, all 'With' variables will be correlated with all 'Variable' variables. Otherwise, correlations will be calculated between every possible pair.

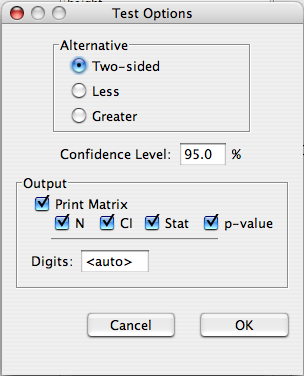
The alternative hypothesis can be specified, as well as the confidence level of the intervals. A number of printing options are also available:

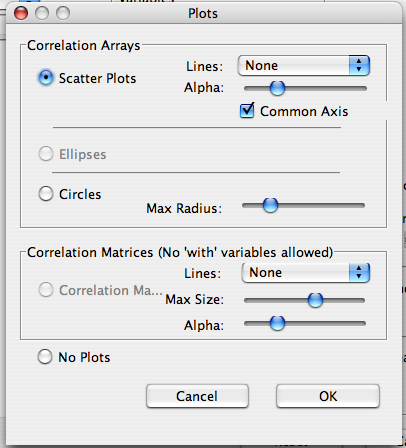
Three types of plots are available for correlations. The third, a full correlation matrix, is only available if no w'With' variables have been specified.

Correlations measure the strength of the relationship between two variables. A correlation can range from -1 to 1, with a correlation of 0 indicating no relationship. If the correlation is negative, there is a negative relationship between the two variables (i.e. one goes up as the other goes down). Likewise, if the correlation is positive, the relationship is positive (i.e. when one goes up, so does the other). The three most common correlation statistics are supported by this dialog.
This is the "Usual" correlation. It estimates the strength of the linear relationship between two variables. It assumes that the sample size is large enough, and that the relationship is actually linear. It is also sensitive to outliers.
This rank correlation is obtained by rank transforming both variables, and then calculating the pearson's correlation on the transformed data. Doing this makes it insensitive to outliers, and relaxes the linearity requirement (it only requires that the relationship be monotonic.
Like Spearmans, Kendall's correlation is not sensitive to outliers, and will detect any monotonic relationship.