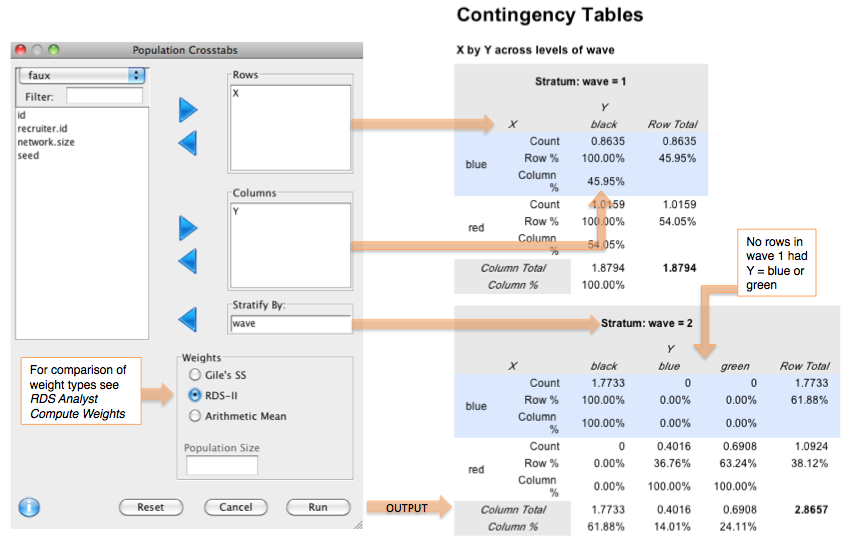
The Population Crosstabs dialog creates contingency tables for the target population based on inference from the sample. The tables show the estimated marginal and joint distribution of characteristics in the population. The column and row totals give point estimates (prevalence rates) for the selected variables -- in the example below, the row totals give the percentage of "blue" and "red" in the population based on RDS-II sampling weights. The tables can optionally be stratified by another variable in the data. Below they are stratified by wave.
Disclaimer: These tables do not show the uncertainty in the estimates. To get a sense of the uncertainty, use the Frequency Estimates dialog, which returns confidence intervals along with point estimates. The point estimates from that dialog should approximately match the ones here if the selected weight type and other settings match.
If you would like to view a contingency table for the sample data alone (no inference on the population) use the Contingency Tables dialog under the Sample menu.
