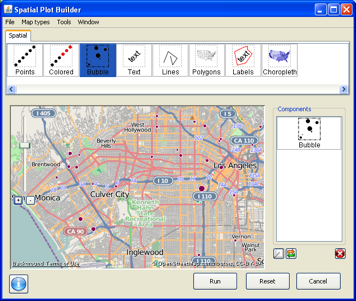
The spatial plot builder allows you to create spatial plots. Before you can begin using the spatial plot builder to plot points or create a bubble plot, you must convert your data to a shape file.
Choose Spatial plot builder from the Spatial menu on the menu bar of the Console Window. The following window will appear.
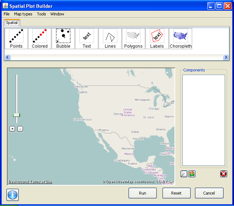
From here, you can plot points, create bubble plots, and many other cool things.
Notice that there is a main area where a map appears, a Components pane on the right, where the elements of your plot will be listed, and a pane across the top with buttons to create different elements.
To plot points, begin by double clicking on the Points button. The following window will appear.
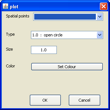
From the pull down menu for Spatial points, select the file to be plotted. From the other pull down menus, choose the type of point, the size and the color.
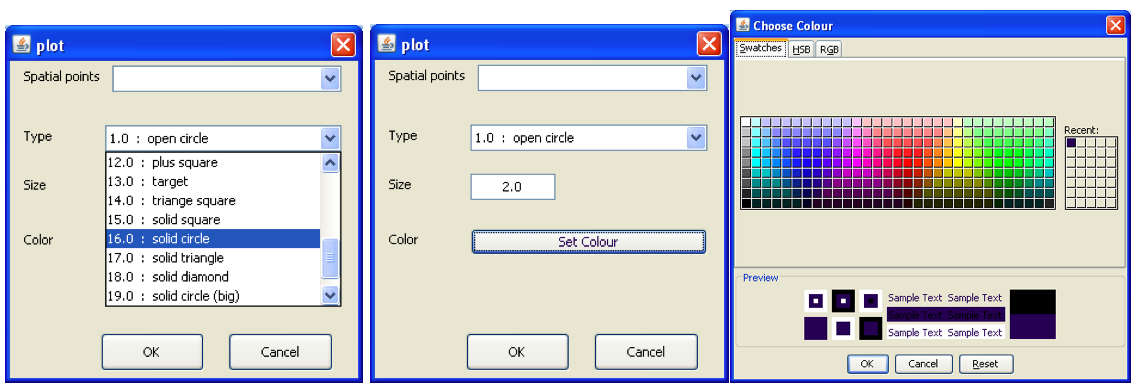
Click OK and the following window will appear.
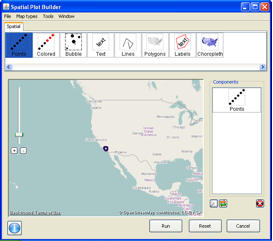
Use + to zoom in to the desired level (- to zoom out). Click and drag the mouse to center the map as desired.
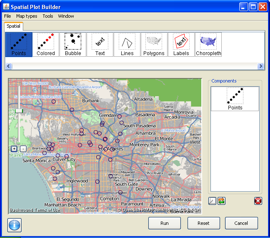
The default map type is open street map. To change from the default, choose the Map types menu and select another map type, such as Bing aerial images. Right clicking on Points in the Components pane provides options to edit, toggle, or remove this map.
To create a bubble plot, begin by double clicking on the Bubble button. The following window will appear.
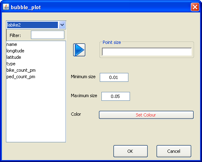
Choose the desired file from the pull down menu. Choose the variable to plot and use the right arrow to place it in the Point size space. Choose the size for the smallest bubble and the largest bubble and set the color. Click OK. Zoom to the desired level. Right clicking on Bubble in the Components pane provides options to make changes or remove the bubble points.
An example bubble plot,
