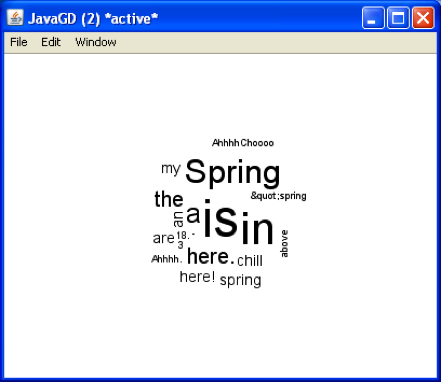
Word counts are just what they sound like: counts of the number of times words occur in a corpus. There are several ways to see word counts. First, you could create a frequency table, which shows each word and the number of times it appears. To make that more visual, you could create a bar plot, which would visualize the counts. Finally, you could create a word cloud, which visualizes the counts by sizing the words in the word cloud according to how often they appear.
To create a word count, you must first create a corpus. Then, choose Text→View Frequency Data→Frequency Totals List from the menu bar of the Console window. The following window will appear.
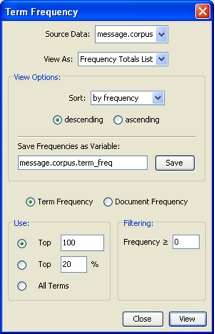
From the pull down menu for Source Data:, choose the file to be analyzed. Remember that if you have preprocessed the corpus you should take care to choose the appropriate Source Corpus from the pull down menu. Deducer will default to the first corpus in the list.
From the View As: pull down menu, choose Frequency Totals List or Bar Chart, or Word Cloud.
If you choose Frequency Totals List or Bar Chart, the view options are by frequency or alphanumerically and in either ascending or descending order.
If you choose Word Cloud, the menus will change slightly.
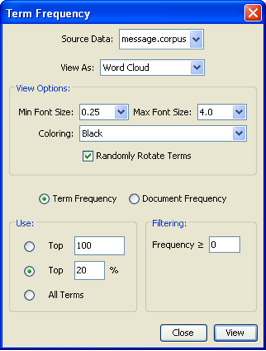
Note that you can vary the font size, change the coloring and randomly rotate the terms in the word cloud.
Frequencies can be run on the x most appearing words in the list, the top x percent, or the entire list. For example, you could just look at the 10 most frequently appearing words. Frequencies can also be filtered so that only words appearing more than a certain number of times will be listed.
By saving the file of frequency data by entering a name in the Save Frequencies as Variable: space, the resulting frequencies will also appear in the Data Viewer.
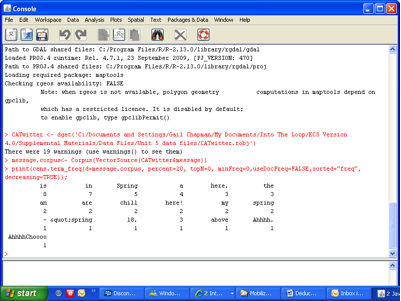
The frequency table appears in the Console window, and gives the number of times each word appeared in the corpus.
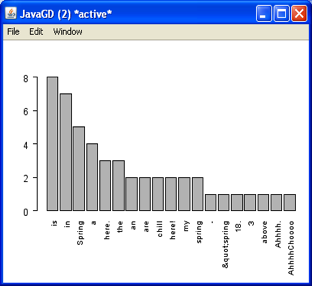
The bar chart visualizes the word frequencies.
The word cloud sizes the words according to how frequent they were in the corpus.
