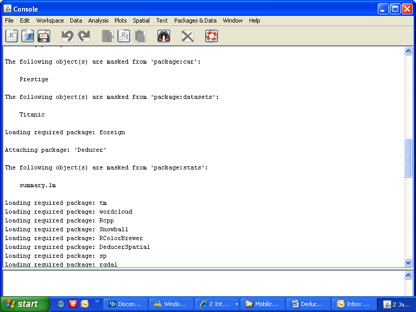
When you launch Deducer (using JGR) you will see two windows, the Console and the Data Viewer. You can use the Data Viewer to open data in order to get started with Deducer.
The Console is where R commands are entered if needed and where the R code that is executed when Deducer features are used appears. Many of the results for the analysis features will appear here as well. The Console window has two panes. The bottom one (the input pane) is for entering the R commands; the top one (the output pane) is where the results appear.
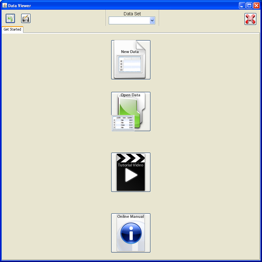
The Data viewer primarily exists to allow you to open and view data, but this is also where you can create your own data, and access help (the online manual or an instructional video).
Once you have opened data in the Data Viewer, the main tab (Data View) of the Data Viewer will look something like this
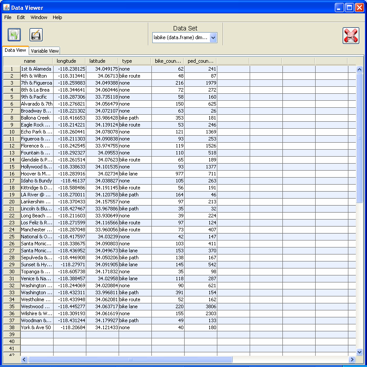
The Data View allows you to view your data just as you would in Excel. You can scroll through to look at it, and use the Data Set drop down menu to switch between different data frames you have open.
However, there is another important tab, Variable View in the Data Viewer.
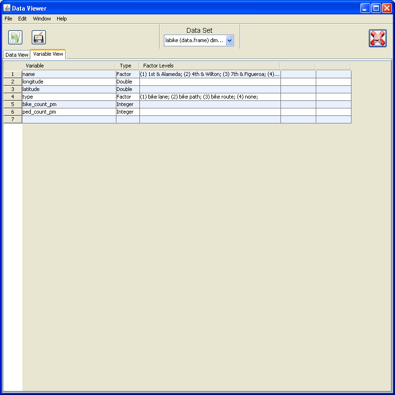
The Variable View provides a list of the variables with their type and factor levels for the categorical variables. If the variable types are mismatched with the data, certain pieces of analysis may not work correctly. If this happens, go to the 'Variable View tab of the Data Viewer to change the variable type.
More information about the data viewer can be found here.
There are many ways to open data using Deducer. You can use the command line in the Console window, you can use the open data option in the File menu, or you can use the Data Viewer.
To open data using the Data Viewer, click on the Open Data button in the Data Viewer and select the file to be loaded. The file will either load directly into the Data Viewer or the following pop-up window will appear.
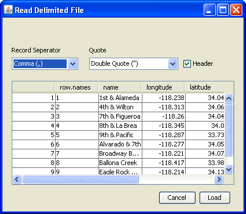
If this happens, use the 'Record Separator' and 'Quote' dropdowns to ensure that the data looks correct in the preview window. The 'Header' checkbox should be checked if the top of your data has labels for every variable, and unchecked if your whole file is data with no labels. Once the data looks correct in the preview window, click 'Load.'
When data is loaded, it appears like this:

Column headings are the names of the variables in the data set; horizontal row numbers indicate each entry. In the above example, there were 38 entries and 6 variables in the file. Columns can be expanded (as in excel) so that the entire entry can be viewed. Scrolling can be used to view additional rows and columns for larger files.
Now that you have your data loaded, you can start doing all kinds of analysis. You can make frequency tables, sort data, subset data, perform spatial analysis, make a variety of plots (bar plots, mosaic plots, histograms, box plots) do analysis (create contingency tables, calculate descriptive statistics, transform data), perform text analysis (create, process and view a corpus, make word counts and word clouds) and much more!
Explore the main page for more information and tutorials.